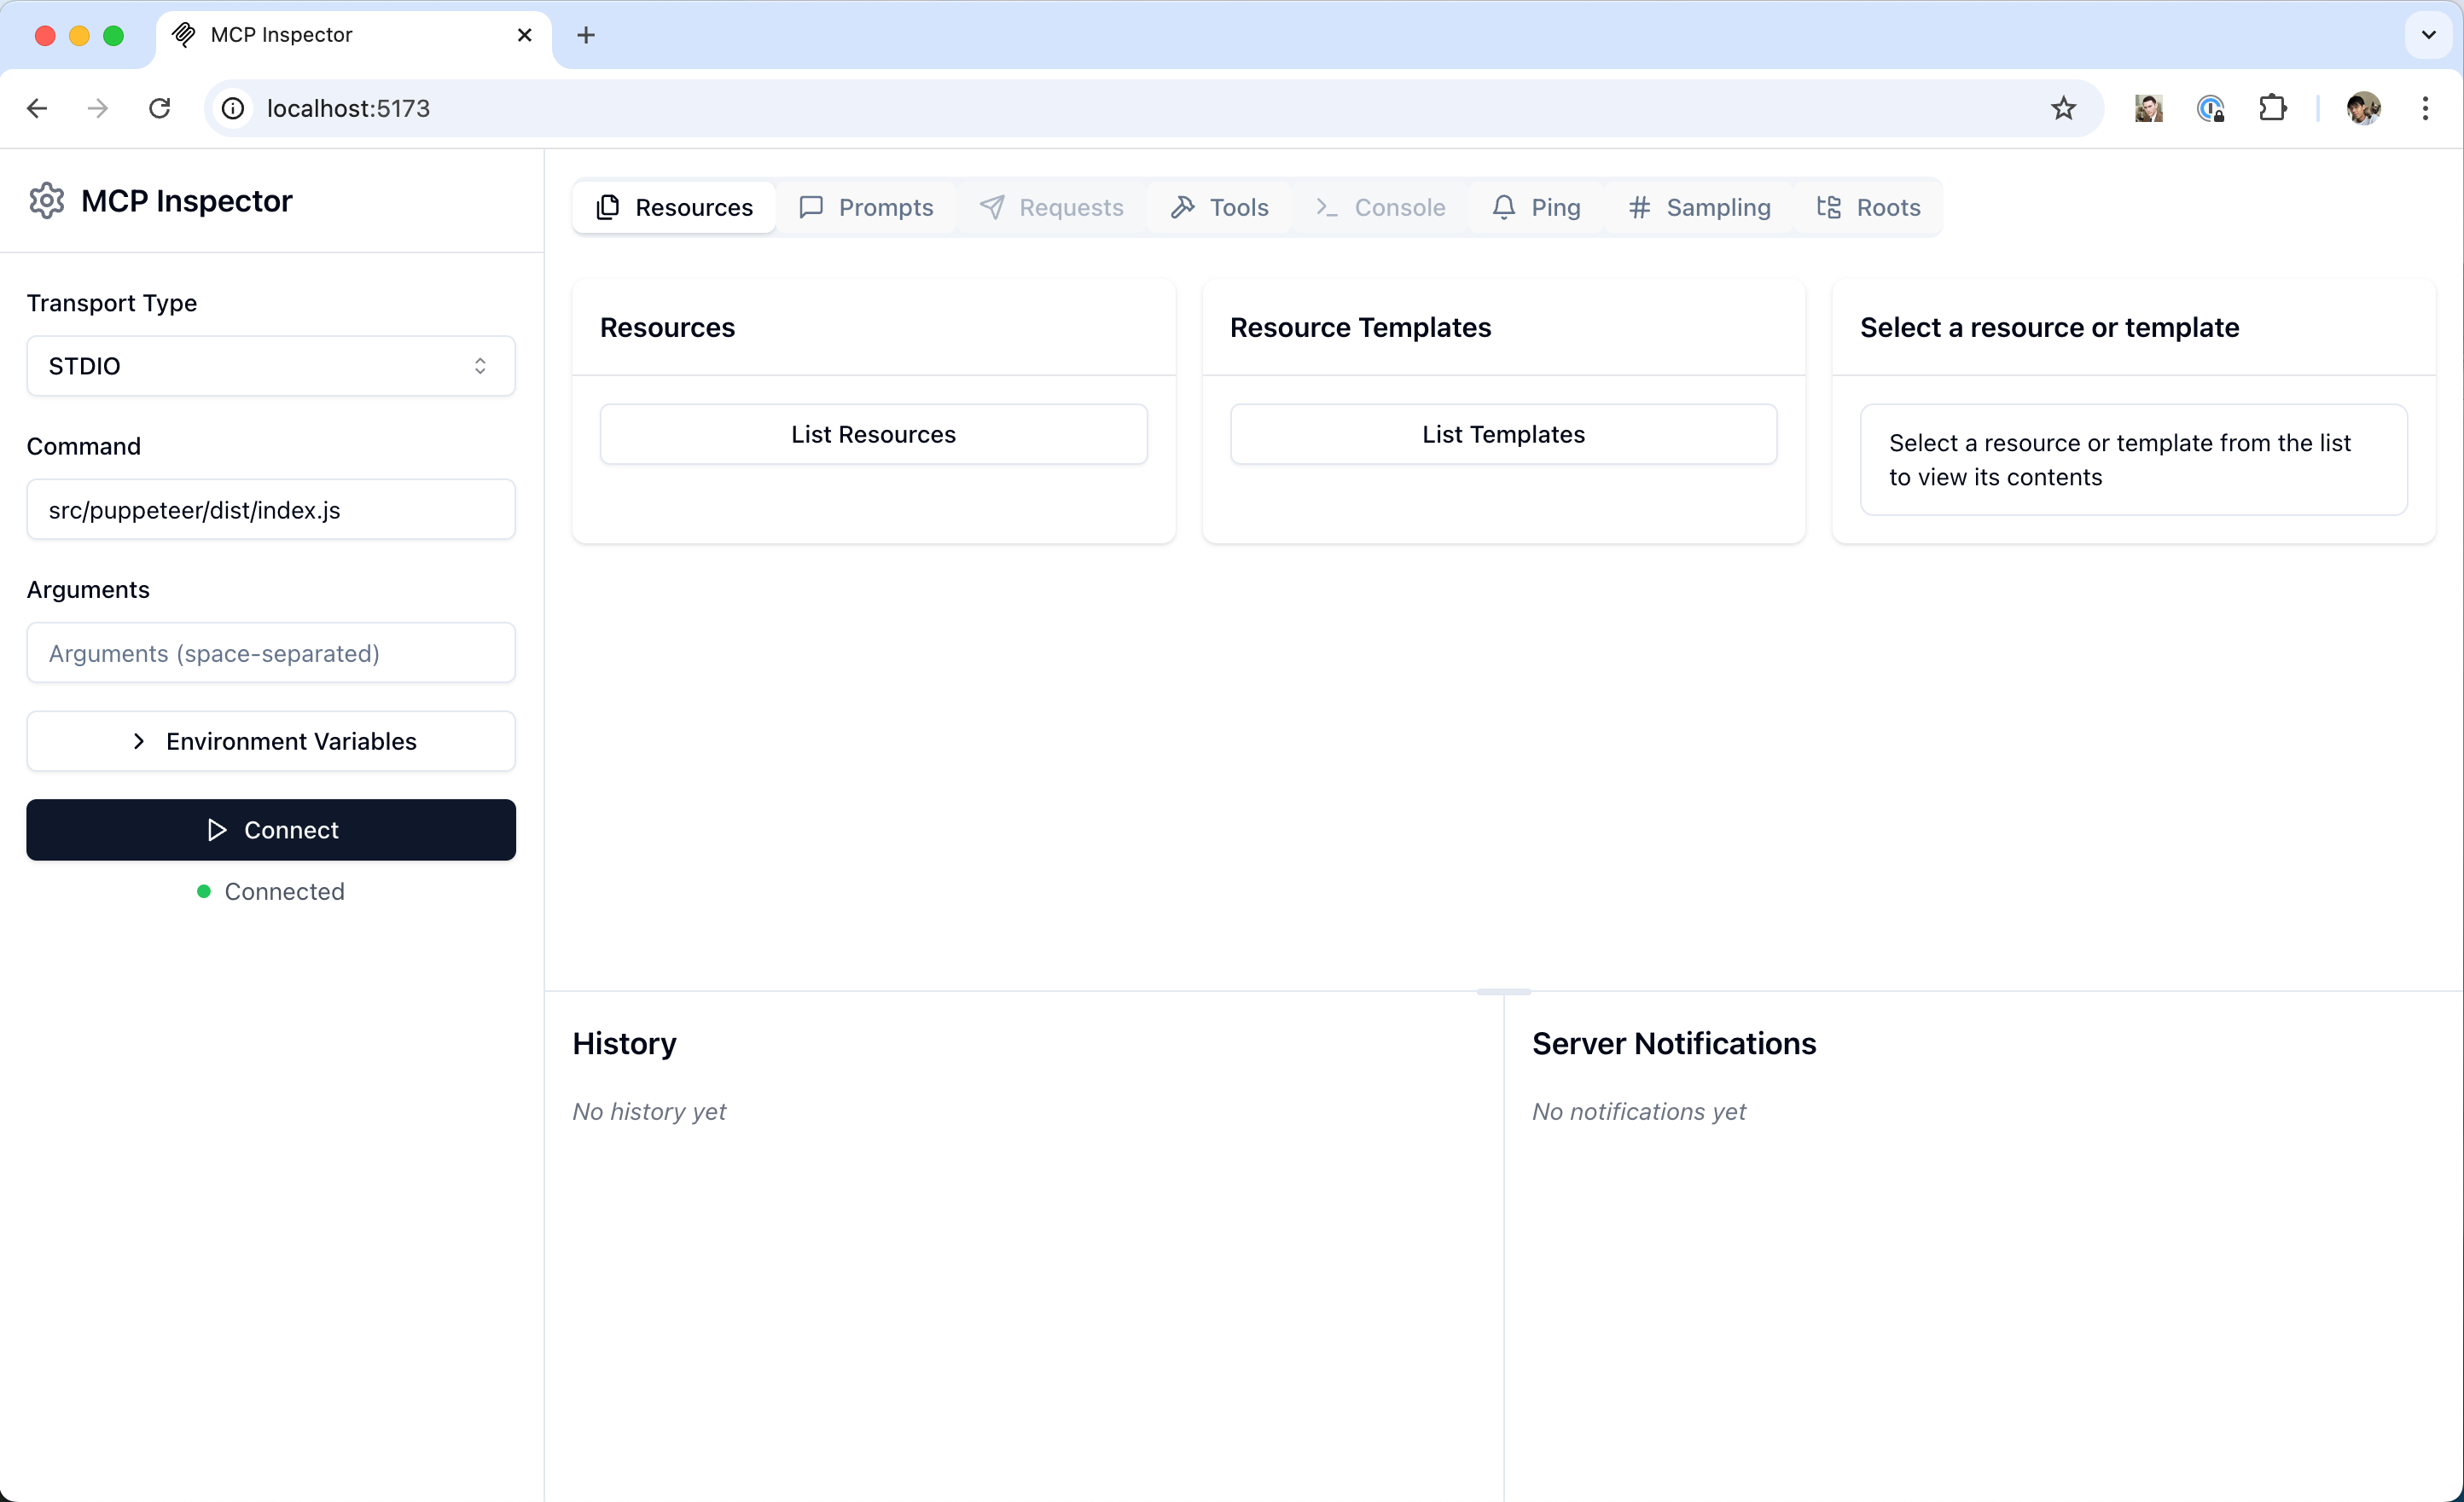
Inspector
The MCP Inspector is an interactive developer tool for testing and debugging MCP servers. While the Debugging Guide covers the Inspector as part of the overall debugging toolkit, this document provides a detailed exploration of the Inspector’s features and capabilities.
Getting started
Installation and basic usage
The Inspector runs directly through npx without requiring installation:
npx @modelcontextprotocol/inspector <command>npx @modelcontextprotocol/inspector <command> <arg1> <arg2>Inspecting servers from NPM or PyPi
A common way to start server packages from NPM or PyPi.
  npx -y @modelcontextprotocol/inspector npx <package-name> <args>
  # For example
  npx -y @modelcontextprotocol/inspector npx server-postgres postgres://127.0.0.1/testdb
npx @modelcontextprotocol/inspector uvx <package-name> <args>
# For example
npx @modelcontextprotocol/inspector uvx mcp-server-git --repository ~/code/mcp/servers.gitInspecting locally developed servers
To inspect servers locally developed or downloaded as a repository, the most common way is:
npx @modelcontextprotocol/inspector node path/to/server/index.js args... npx @modelcontextprotocol/inspector \
uv \
--directory path/to/server \
run \
package-name \
args...Please carefully read any attached README for the most accurate instructions.
Feature overview

The Inspector provides several features for interacting with your MCP server:
Server connection pane
- Allows selecting the transport for connecting to the server
- For local servers, supports customizing the command-line arguments and environment
Resources tab
- Lists all available resources
- Shows resource metadata (MIME types, descriptions)
- Allows resource content inspection
- Supports subscription testing
Prompts tab
- Displays available prompt templates
- Shows prompt arguments and descriptions
- Enables prompt testing with custom arguments
- Previews generated messages
Tools tab
- Lists available tools
- Shows tool schemas and descriptions
- Enables tool testing with custom inputs
- Displays tool execution results
Notifications pane
- Presents all logs recorded from the server
- Shows notifications received from the server
Best practices
Development workflow
Start Development
- Launch Inspector with your server
- Verify basic connectivity
- Check capability negotiation
Iterative testing
- Make server changes
- Rebuild the server
- Reconnect the Inspector
- Test affected features
- Monitor messages
Test edge cases
- Invalid inputs
- Missing prompt arguments
- Concurrent operations
- Verify error handling and error responses